I have many builds, and not all use the same tasks (tools) to run the tests. I will try to cover collecting code coverage numbers inside of a build, and failing the build if percentages are lower than expected
dotnet test /p:CollectCoverage=true
The usage of dotnet cli is skyrocketed in our pipelines. it is easy and can bu run everywhere including docker images.
You can simply add dotnet-reportgenerator to summarize the result and read the “Line coverage”
string. The line should be like Line coverage: 68.1%, just extract the number and compare it with the expected percentage. If it is lower Write-Error, VSTS will catch this as an error and fails the build, otherwise Write-Host to let people know the result. (Bash file is not the best and if you have a better version please share in a comment)
this technique can be used anywhere you can add PowerShell or Bash task to your VSTS build and use this or simply add this to your docker image build
PowerShell
Bash
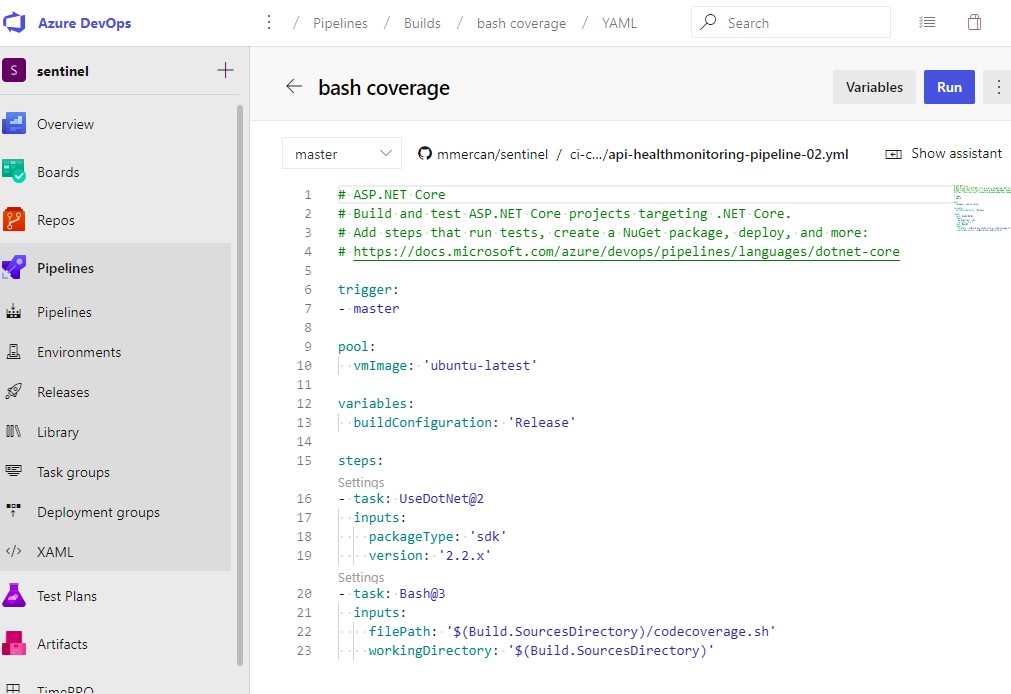
Azure DevOps (VSTS) “VSTest” Task
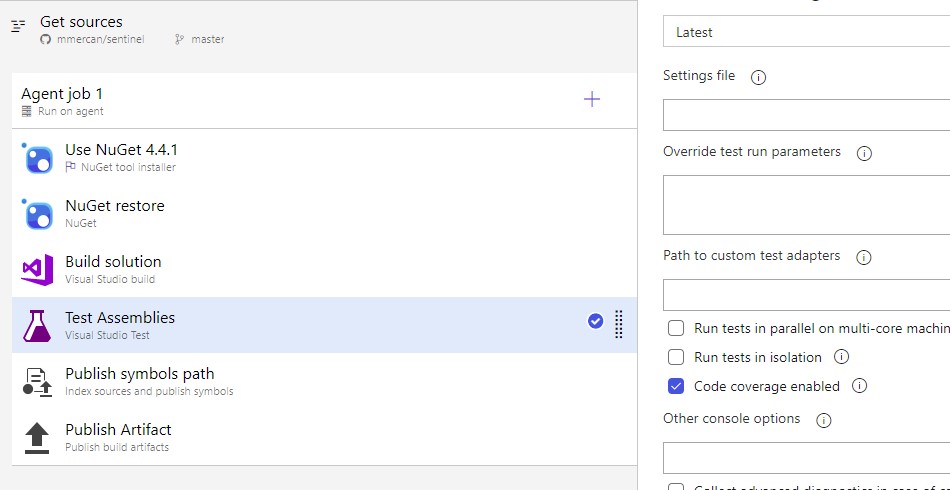
If you are using VSTS tasks to build, probably you will have VsTest Task on your pipeline (as it is the default option when you select ASP.NET Template)
VsTask is capable of getting the Code coverage, but you need to check the option Code coverage enabled from the task options.
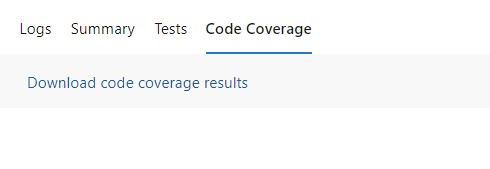
if Code coverage is enabled and run your build, you should have a tab for Code coverage in your build result page you can download the coverage file open in visual studio and see what lines of your code is covered.
Now we need to use VSTS Rest API to get Code coverage numbers and decide the success or the failure of the build. If you are still using tasks on your build, you need to enable Allow scripts to access the OAuth token in the agent Job level. If you are using YAML base builds token access is allowed by default. We need to access the token to use in VSTS Rest API for Authentication.

Before getting into the Script you might want to check the VSTS _apis/test/codecoverage API from https://docs.microsoft.com/en-us/rest/api/azure/devops/test/code%20coverage/get%20build%20code%20coverage?view=azure-devops-rest-5.1
This is the PowerShell script uses an API to get code coverage data for a build. The result we get is a JSON. modules array contains projects and their linesNotCovered and linesCovered integer numbers.
{
  "value": [
    {
      "configuration": {
        "id": 51,
        "flavor": "Debug",
        "platform": "Any CPU",
        "uri": "vstfs:///Build/Build/363",
        "project": {}
      },
      "state": "0",
      "lastError": "",
      "modules": [
        {
          "blockCount": 2,
          "blockData": "Aw==",
          "name": "fabrikamunittests.dll",
          "signature": "c27c5315-b4ec-3748-9751-2a20280c37d5",
          "signatureAge": 1,
          "statistics": {
            "blocksCovered": 2,
            "blocksNotCovered: 4,
            "linesNotCovered":2,
            "linesCovered": 4
          },
          "functions": []
        }
      ],
      "codeCoverageFileUrl": "https://dev.azure.com/fabrikam/Fabrikam-Fiber-TFVC/_api/_build/ItemContent?buildUri=vstfs%3A%2F%2F%2FBuild%2FBuild%2F363&path=%2FBuildCoverage%2FFabrikamUnitTests_20150609.2.Debug.Any%20CPU.51.coverage"
    }
  ],
  "count": 1
}
In Powershell we will request the JSON from VSTS if we can get the result (there is always a possibility to not getting the coverage as there might be nothing to test or coverage check not selected) script will loop through all modules (projects) and add their covered and not covered blocks and calculate the overall coverage if it is less the expected Percentage it will Write-Error and VSTS task will fail, otherwise it will report the code coverage numbers with Write-Host
SonarQube Quality Gate
On SonarQube we can simply access the /api/qualitygates/project_status API with project key and get the result of the quality gate of your project but as analysis is a background task and can take a while, when you hit the API you may get the previous result and you don’t want to have that.
SonarQube scanners generally create a report-task.txt file. This file contains the ceTaskUrl which has the field for anaysisId to access our unique quality gate result.
dotnet core SonarScanner store it in out\.sonar folder on the current directory you run the SonarScanner
npm sonar-scanner store it in .scannerwork folder on the current directory you run the sonar-scanner
report-task.txt File
organization=mmercan-github
projectKey=Sentinel.Api.HealthMonitoring
serverUrl=https://sonarcloud.io
serverVersion=8.0.0.884
dashboardUrl=https://sonarcloud.io/dashboard?id=Sentinel.Api.HealthMonitoring
ceTaskId=AW2LcrjNeWHkXTI8--hG
ceTaskUrl=https://sonarcloud.io/api/ce/task?id=AW2LcrjNeWHkXTI8--hG
PowerShell simply tries to access the report-task.txt file read ceTaskUrl and make a WebRequest to the URL with Authorization header. The result of this request is a JSON with the field name analysisId.
{
   "task":{
      "id":"AW2LcrjNeWHkXVU8--hG",
      "type":"REPORT",
      "componentId":"AWyNtuseubB2nFeSSwHh",
      "componentKey":"Sentinel.UI.HealthMonitoring",
      "componentName":"Sentinel.UI.HealthMonitoring",
      "componentQualifier":"TRK",
      "analysisId":"AW2Lcrqhc8gQ3aLgr-Md",
      "status":"SUCCESS",
      "submittedAt":"2019-10-02T09:50:14+0200",
      "submitterLogin":"mmercan@github",
      "startedAt":"2019-10-02T09:50:14+0200",
      "executedAt":"2019-10-02T09:50:19+0200",
      "executionTimeMs":4350,
      "logs":false,
      "hasScannerContext":true,
      "organization":"mmercan-github",
      "warningCount":0,
      "warnings":[ ]
      }
}
We make a second WebRequest to /api/qualitygates/project_status?analysisId=$Response.task.analysisId with adding the analysisId from the first WebRequest
Second WebRequest also result with a JSON response, if projectStatus.status is “OK” or “NONE” we accept this as a success any other result will cause a double error Write-Error and Write-Output “##vso[task.complete result=Failed;]” this is overkill if you are using the VSTS PowerShell task as it translates Write-Error to a task fail too.
{
  "projectStatus": {
    "status": "ERROR",
    "conditions": [
      {
        "status": "ERROR",
        "metricKey": "new_reliability_rating",
        "comparator": "GT",
        "periodIndex": 1,
        "errorThreshold": "1",
        "actualValue": "2"
      },
      {
        "status": "OK",
        "metricKey": "new_security_rating",
        "comparator": "GT",
        "periodIndex": 1,
        "errorThreshold": "1",
        "actualValue": "1"
      },
      {
        "status": "OK",
        "metricKey": "new_maintainability_rating",
        "comparator": "GT",
        "periodIndex": 1,
        "errorThreshold": "1",
        "actualValue": "1"
      },
      {
        "status": "ERROR",
        "metricKey": "new_coverage",
        "comparator": "LT",
        "periodIndex": 1,
        "errorThreshold": "80",
        "actualValue": "71.42857142857143"
      },
      {
        "status": "ERROR",
        "metricKey": "new_duplicated_lines_density",
        "comparator": "GT",
        "periodIndex": 1,
        "errorThreshold": "3",
        "actualValue": "30.493273542600896"
      }
    ],
    "periods": [
      {
        "index": 1,
        "mode": "days",
        "date": "2019-08-29T08:56:43+0200",
        "parameter": "30"
      }
    ],
    "ignoredConditions": false
  }
}
PowerShell
